2 min to read
#100DaysOfNLP Day 7 and 8: Visualizing Parts of Speech data, Sentiment Data, and NER Data.
On Day 7 of my 100 Days of NLP journey, I begin to visualize the Parts of Speech tagged data for the Cornell Movie-Dialogs Corpus.
On Day 7 and Day 8 (June 17th and June 18th) of my 100 Days Of NLP journey, I went to work on visualizing the Parts of Speech tagged data that I had created on Day 6. I also conducted sentiment analysis on the data based on the gender of the speakers of the lines and then proceeded to visualize that data. Without further ado, let’s get into what the results for the day were and what I learned. If you’re unfamiliar with the research problem I’m currently working on
What I Learned:
Today’s tasks mostly focused on being able to visualize data as well as a little bit of sentiment analysis. I got a lot more comfortable with matplotlib and ended up not having to read the documentation for today’s work which was incredibly nice. I also used NLTK’s VADER for sentiment analysis and got comfortable with that. All the code that I wrote today is available on the github repository for the project, the file names are self explanatory: graphdata.py visualizes the data. The next section of this post will quickly highlight our results for Day 7 and Day 8 and I’ll also outline our plans for next week’s work!
Results:
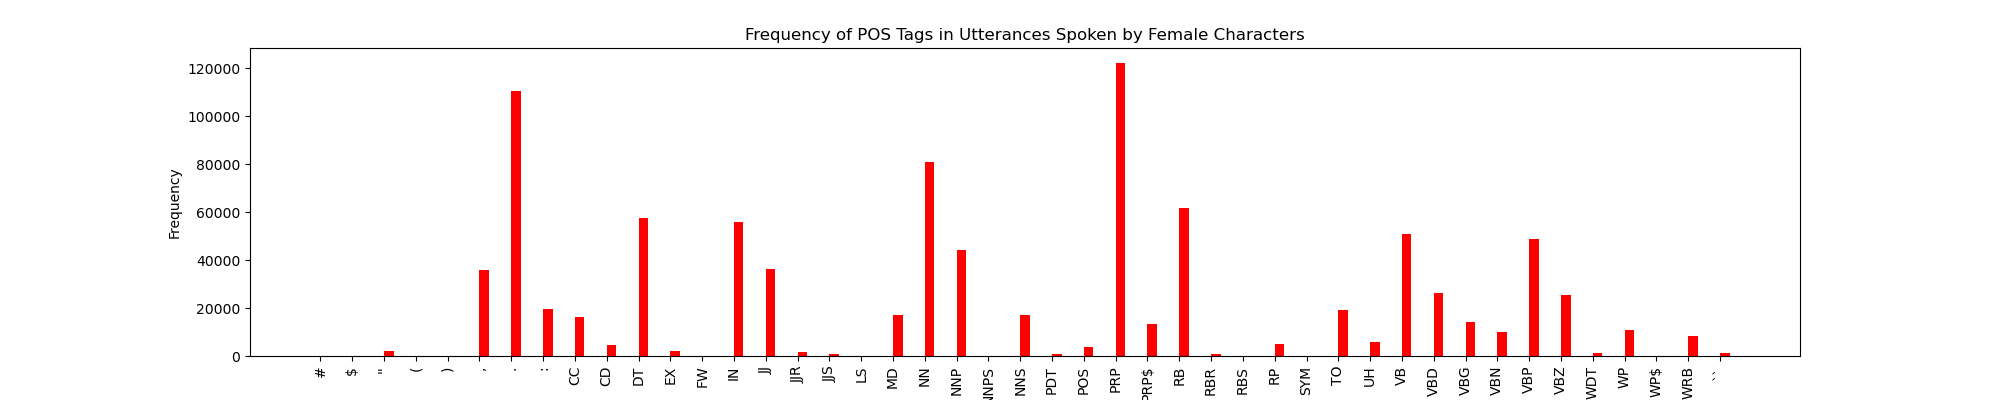
An important thing to note before I present these results is that there is a much larger number of male lines than female lines and our POS graphs show actual number of Parts of Speech tags rather than percentages, this will change shortly in the future. However, keep that in mind as you look at our current results.
Here’s what our POS tag statistics for characters of female gender looks like:
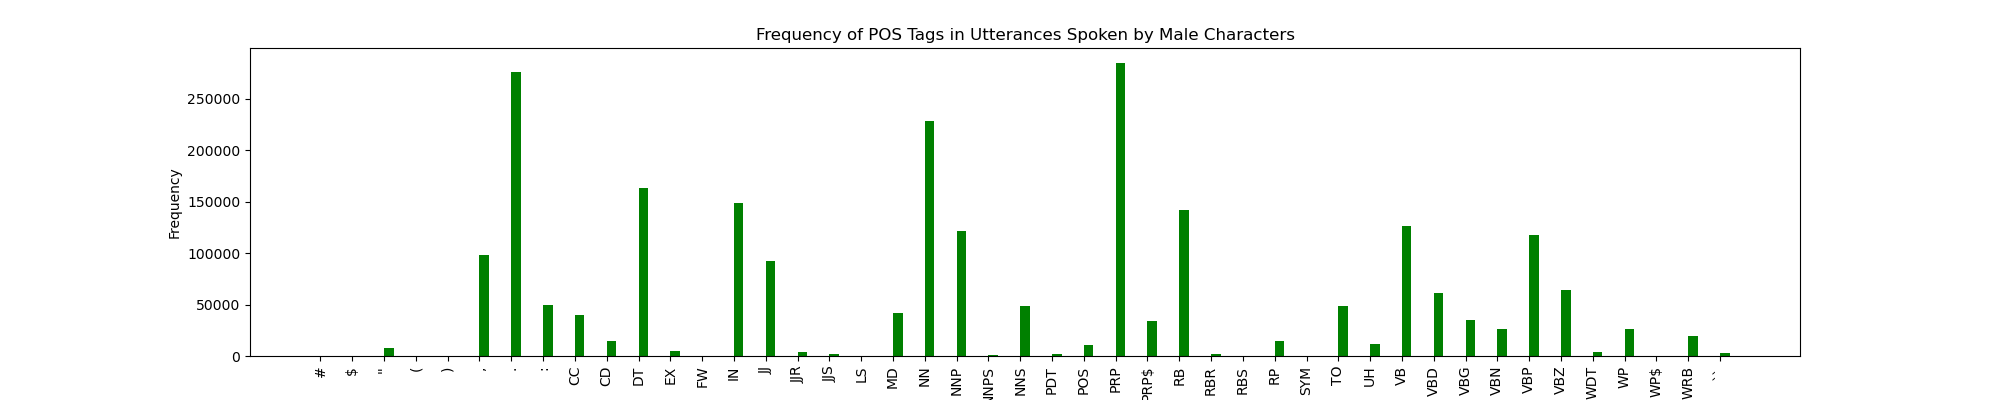
Here’s what the same thing looks like for male characters:
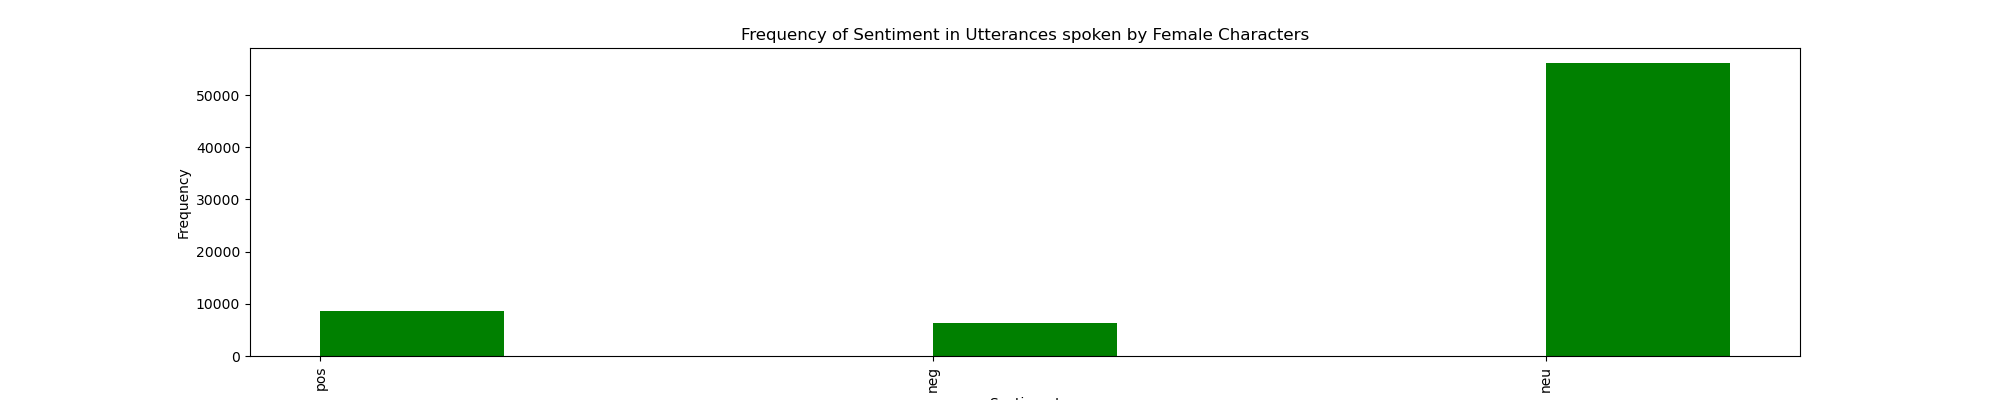
I also conducted sentiment analysis of the data:

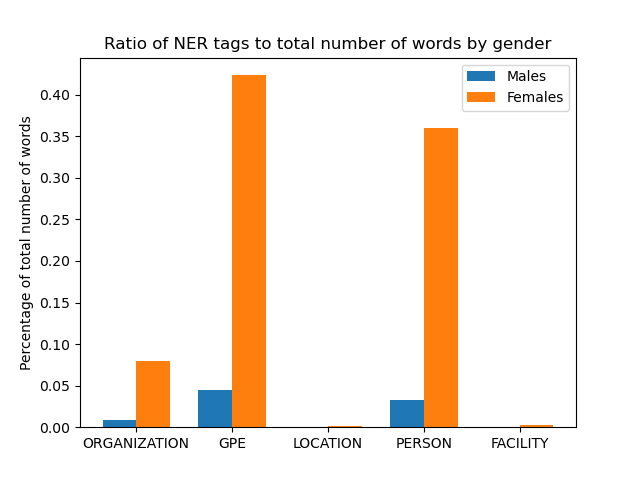
As well as our NER tags which produced really interesting results:

Female characters had 0.8 percent of their lines contain named entities while male characters only had 0.08 percent of the lines. Those are our current results, and we’ll be continuing to explore our data and begin work on building our classifier soon. Sign up for my newsletter down below if you want to keep up with my journey!

Comments